
Excel for Analytics
Organise datasets, use formulas and functions, and summarise information with PivotTables.
FormulasPivotTablesCharts
Learn Data Analytics through practical work with Excel, SQL, data cleaning, dashboards, reporting and business insights. Build portfolio-ready analysis projects with guidance from RK Technology.
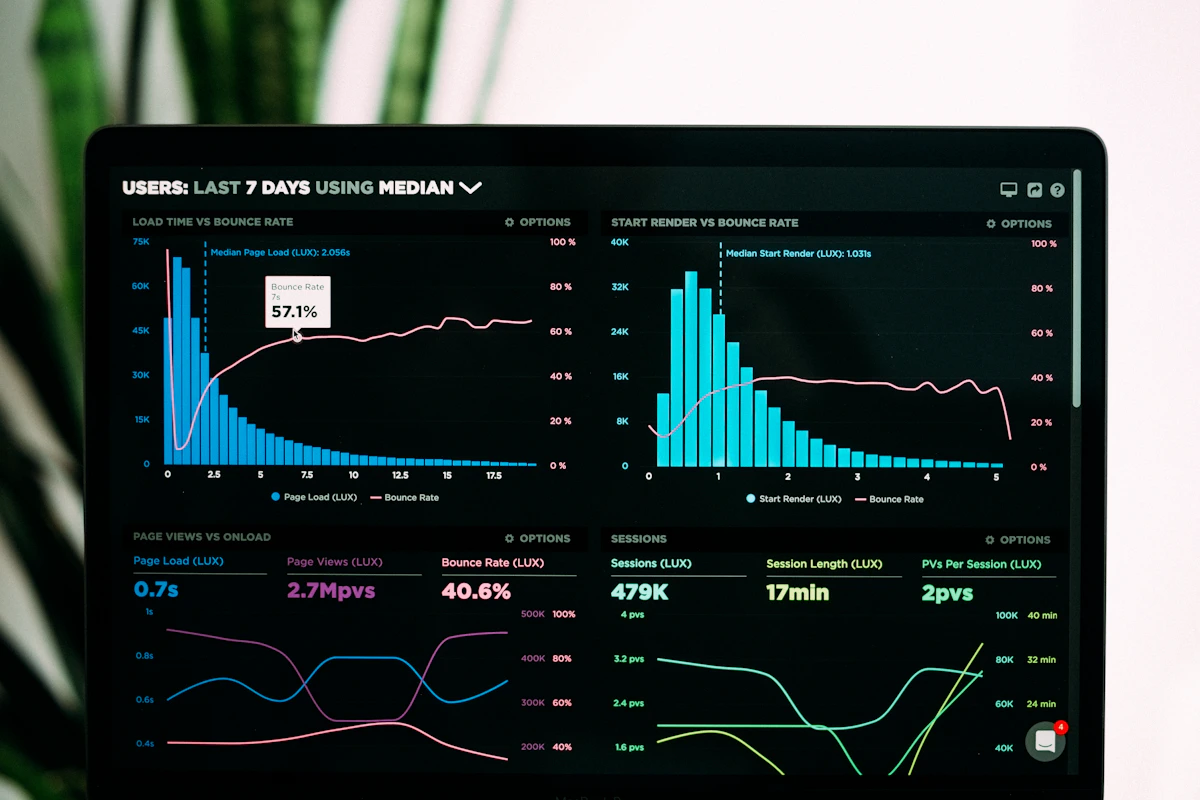

Data Analytics turns raw information into useful business insights. Learn a practical workflow using spreadsheets, SQL, data cleaning, exploratory analysis, visualisation, dashboards and clear reporting.
Course duration, framework, batch schedule, fees and current delivery format should be confirmed directly with RK Technology.
Ask for Course Details ↗Build confidence through guided exercises, real datasets and hands-on reporting.
Organise datasets, use formulas and functions, and summarise information with PivotTables.
Fix inconsistent values, remove duplicates, standardise formats and prepare reliable datasets.
Retrieve, filter, join and aggregate data from relational databases using practical SQL queries.
Choose suitable charts and present comparisons, trends and relationships clearly.
Build interactive reports, connect data sources and communicate performance through dashboards.
Translate analysis into concise reports, meaningful KPIs and practical recommendations.
Progress from spreadsheet fundamentals to SQL, data preparation, dashboard design, business reporting and practical analytics projects. Topics may vary by batch.
Understand the analytics workflow, business questions and reliable data sources.
Use spreadsheet tools to clean, calculate and summarise data.
Prepare consistent datasets before analysis.
Query relational data and combine information across tables.
Explore datasets to find patterns, exceptions and useful comparisons.
Choose visuals that make findings easy to understand.
Create interactive reports that help stakeholders monitor performance.
Turn analysis into clear findings and recommended next steps.
Make analysis reliable, clear and repeatable.
Combine cleaning, analysis, visualisation and reporting in a portfolio project.
Use these notes as a revision guide. Practise each concept in a spreadsheet or dashboard and explain what the results mean.
Data Analytics is the process of collecting, cleaning, exploring and interpreting data to answer business questions. It helps teams monitor performance, understand trends and make evidence-based decisions.
Define the question → gather data → clean and validate → analyse → visualise → communicate recommendations.
A Data Analytics workflow starts with a business question and dataset, then moves through cleaning, exploration, calculation, visualisation and communication.
#include <stdio.h>

int main(void) {
    char name[40] = "Ravi";
    int age = 21;
    printf("Hello %s, age %d\n", name, age);
    return 0;
}
Practise importing a spreadsheet, checking data types, summarising values and handling missing data in Excel or Power Query.
Reusable formulas, structured tables and documented steps help keep analysis clear, repeatable and easier to review.
#include <stdio.h>

int add(int a, int b) {
    return a + b;
}

int main(void) {
    printf("Sum: %d\n", add(4, 6));
    return 0;
}Exploratory Data Analysis (EDA) uses summaries, tables and charts to understand patterns, spot anomalies and explore relationships before drawing conclusions.
#include <stdio.h>

int main(void) {
    for (int i = 1; i <= 5; i++) {
        printf("%d\n", i);
    }
    return 0;
}
Use summary tables, PivotTables, histograms and scatter plots to inspect data. Check whether missing values or outliers may affect conclusions.
SQL helps retrieve and aggregate records from databases, while Power Query supports data transformation. Visualisation tools help communicate patterns clearly.
#include <stdio.h>

int main(void) {
    int score[] = {70, 85, 92};
    int *ptr = score;
    printf("First score: %d\n", *ptr);
    return 0;
}
Practise array indexing, string handling, address-of (&) and dereference (*) operators. Avoid accessing memory outside array bounds.
Statistics help summarise data and quantify variation, patterns and uncertainty.
#include <stdio.h>

struct Student {
    int id;
    char name[30];
};

int main(void) {
    struct Student s = {101, "Asha"};
    printf("%d: %s\n", s.id, s.name);
    return 0;
}
Review central tendency, spread, probability, sampling and the difference between correlation and causation.
Data analytics uses descriptive and diagnostic methods to explain performance and identify patterns. A good workflow includes validation and careful choice of metrics.
#include <stdio.h>
#include <stdlib.h>

int main(void) {
    int *values = malloc(3 * sizeof *values);
    if (values == NULL) return 1;
    values[0] = 10;
    printf("%d\n", values[0]);
    free(values);
    return 0;
}
Understand descriptive, diagnostic and trend analysis, and compare results using clearly defined business metrics.
Data import and export allow analysts to work with CSV, Excel and database sources. Validate column names, missing values and data types after loading.
#include <stdio.h>

int main(void) {
    FILE *file = fopen("notes.txt", "w");
    if (file == NULL) return 1;
    fputs("Practise C every day.\n", file);
    fclose(file);
    return 0;
}
Practise importing CSV and Excel files, exporting cleaned data and documenting the steps used to transform it.
Prefer reproducible notebooks, reliable validation, clear charts and honest explanations of uncertainty.
| Term | Meaning |
|---|---|
| Dataset | A collection of related records used for analysis. |
| KPI | A measurable indicator used to track performance against a goal. |
| PivotTable | A tool for grouping and summarising spreadsheet data. |
| SQL | A language used to query and manage relational data. |
| JOIN | A SQL operation that combines rows from related tables. |
| Data cleaning | Finding and correcting missing, inconsistent or inaccurate values. |
| Dashboard | A visual summary of key metrics and trends. |
| Data model | A structured representation of tables and their relationships. |
| Outlier | A value that differs substantially from the general pattern. |
| Data storytelling | Explaining insights and recommendations with evidence and visuals. |
Tool choices can vary by batch and project. Focus on understanding the workflow, then practise with the versions used in class.
Start with clear questions and well-documented datasets. Explain your cleaning choices, analysis, visualisations and conclusions for each project.

Clean a public dataset, explore trends and outliers, and present the most useful findings in a concise report.
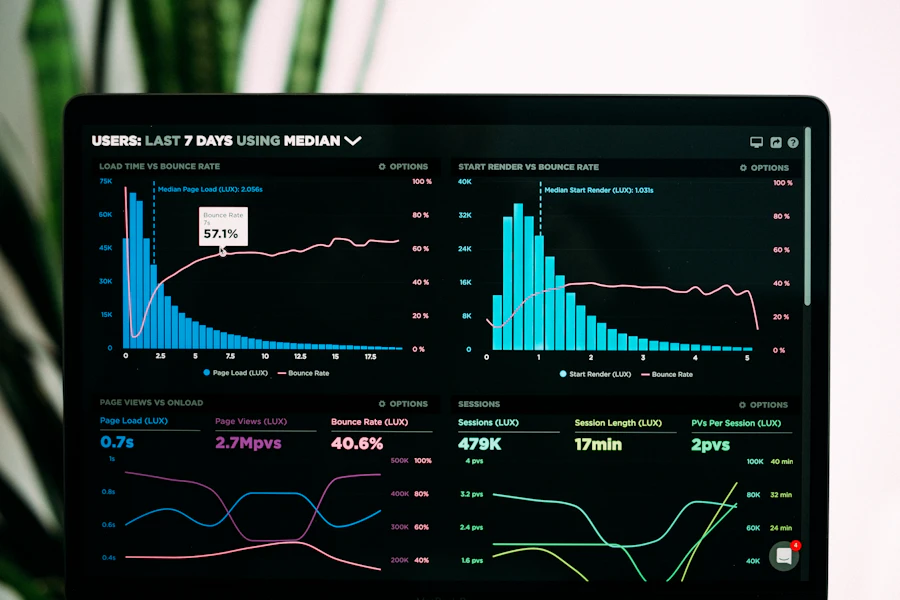
Use Excel and SQL to analyse sales by product, region and time period; create a dashboard and recommend evidence-based next steps.

Transform a dataset, define useful KPIs, build an interactive dashboard and explain the trends and recommendations.
Share your details to ask about the current course. This form opens WhatsApp with a prepared message; it does not send anything until you review and send the message in WhatsApp.
RK Technology
Dilsukhnagar, Hyderabad, Telangana, India
Phone / WhatsApp: +91 88868 38189
Here are some useful starting points before you enquire.
Yes. Beginners can start with basic computer skills and spreadsheet fundamentals, then progress into SQL, data cleaning, dashboards and reporting through regular practice.
Basic computer skills and a willingness to practise are useful. Ask RK Technology whether the current batch starts from programming fundamentals and whether any prerequisites apply.
The syllabus may cover Excel, SQL, data cleaning, Power BI, visualisation and business reporting. Contact RK Technology to confirm the current batch details.
Practice ideas include sales trend analysis, business KPI dashboards, customer or inventory reports, and data quality analysis. Confirm which projects are included in the current batch.
Duration, fees and batch schedules can change. Contact RK Technology directly for the latest confirmed details.
No course can responsibly guarantee an individual job outcome. Hands-on practice, a clear project portfolio, analytical thinking and interview preparation can help improve job readiness. Ask the institute what career support is available.